updated 2/28/2017
Statistical Analysis
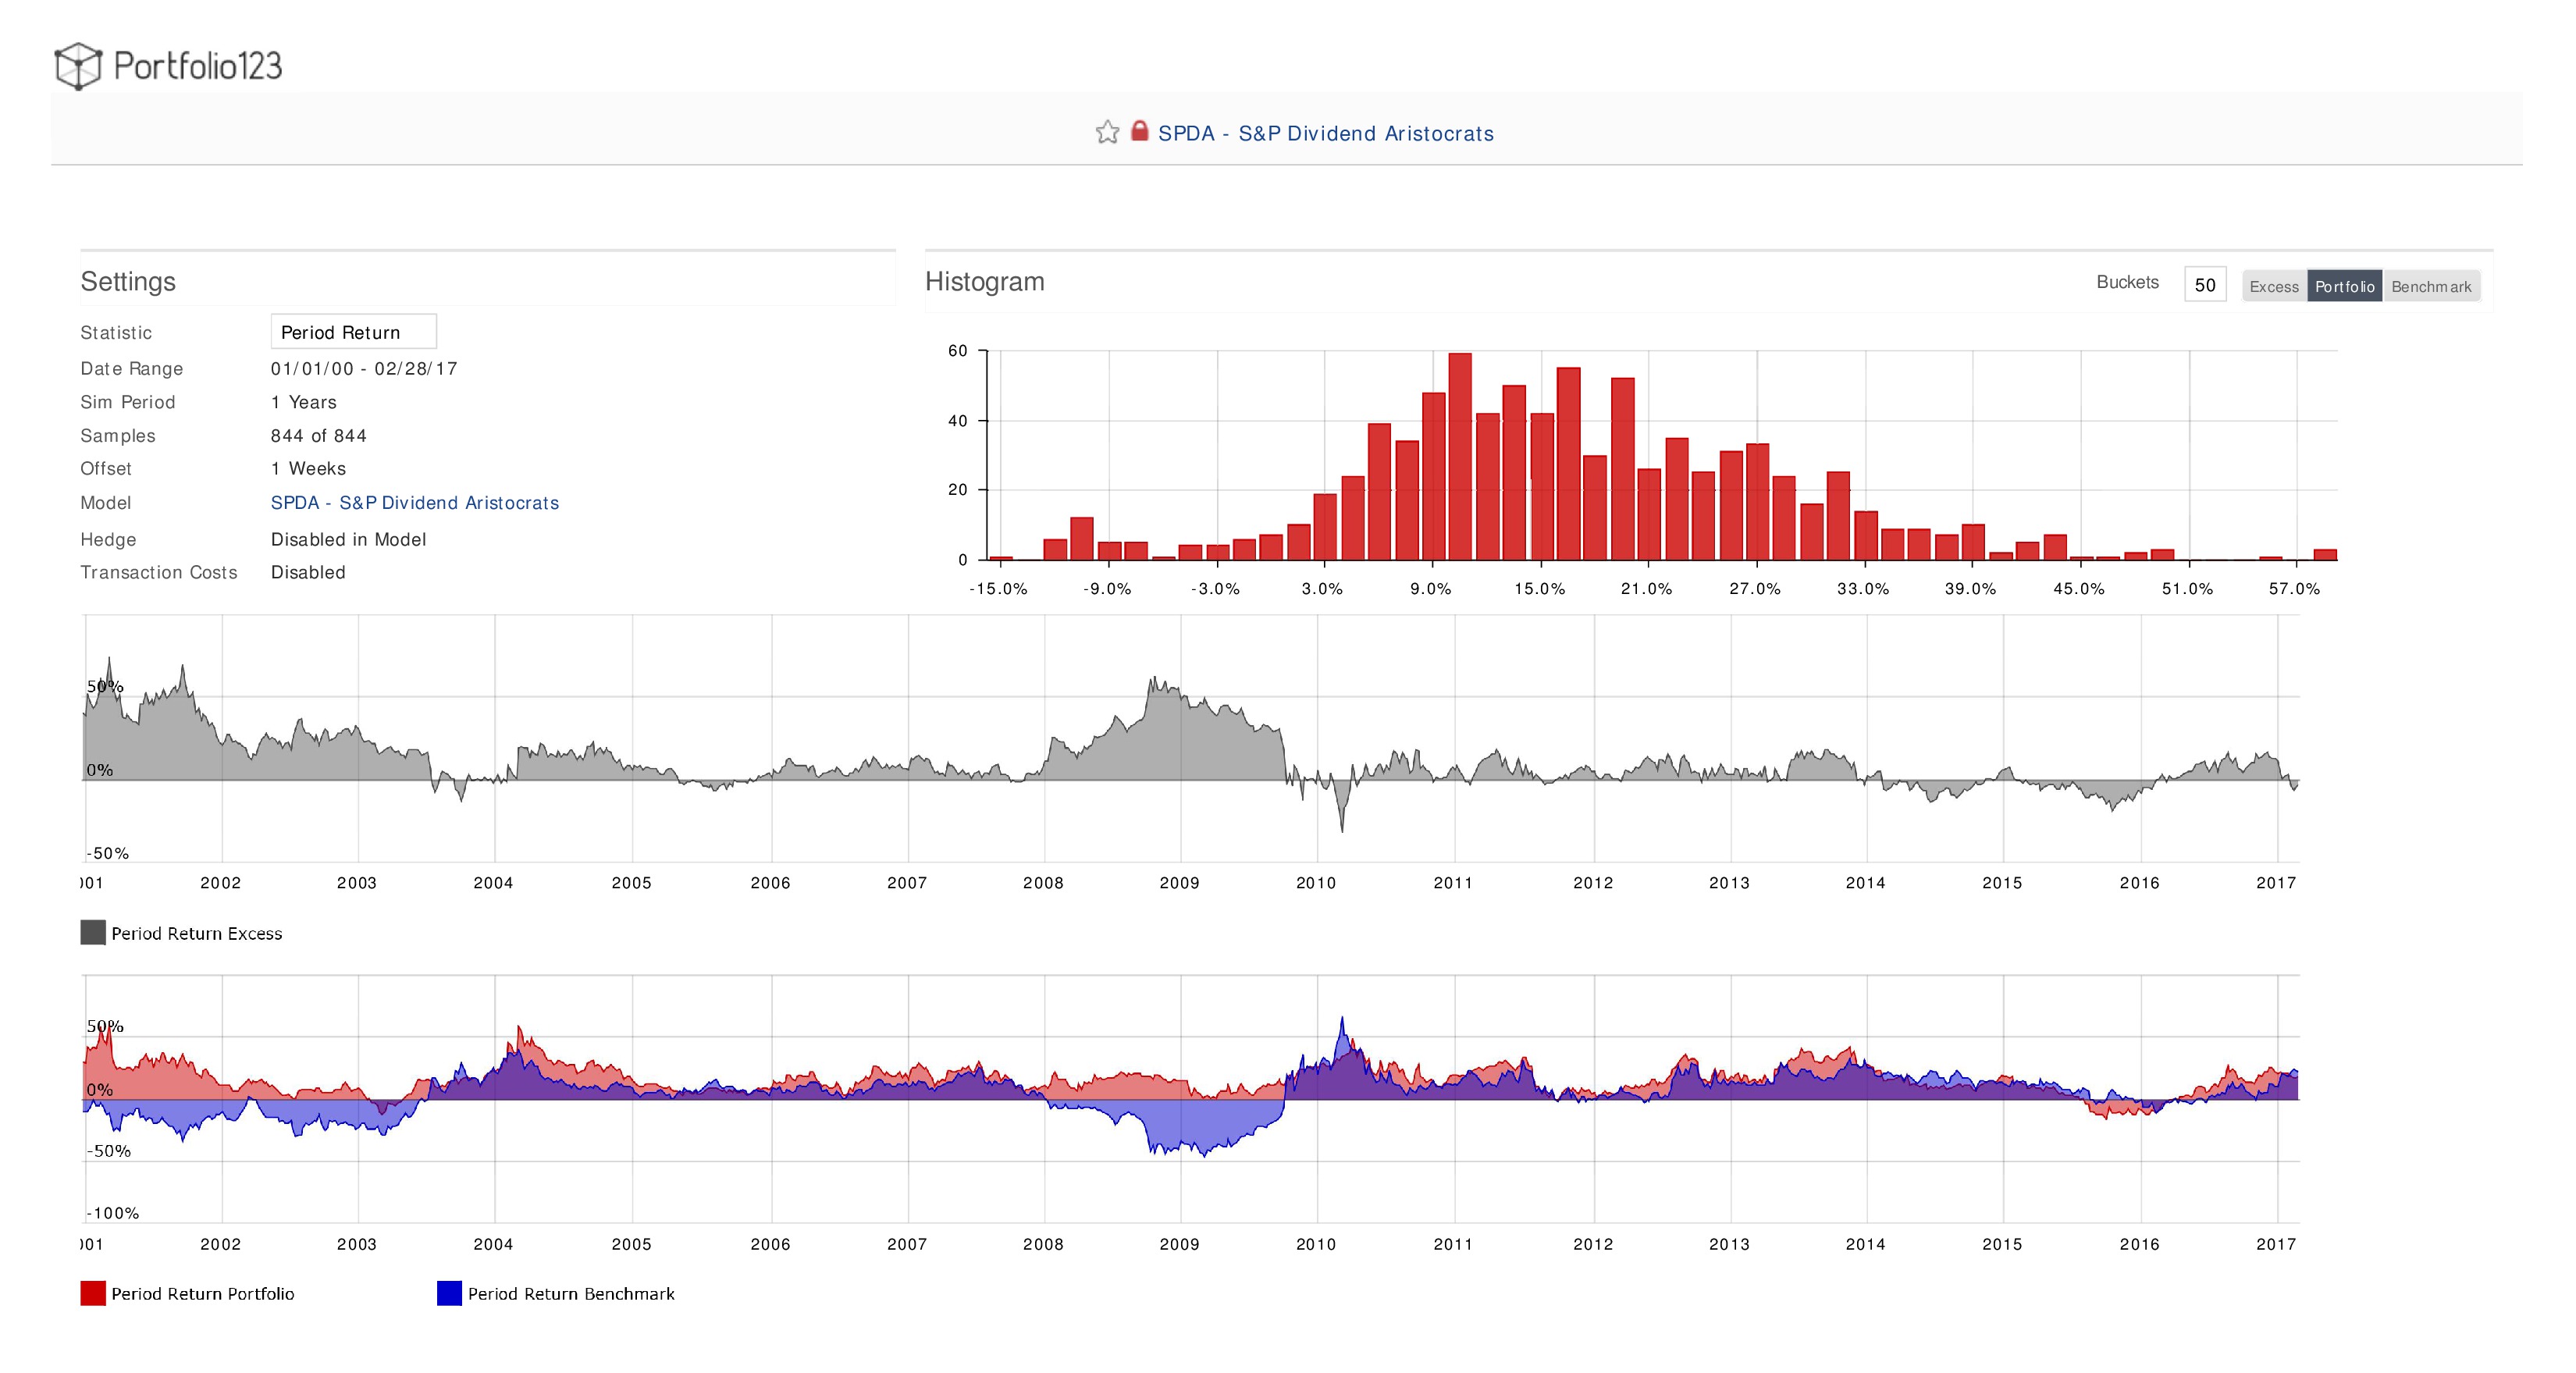
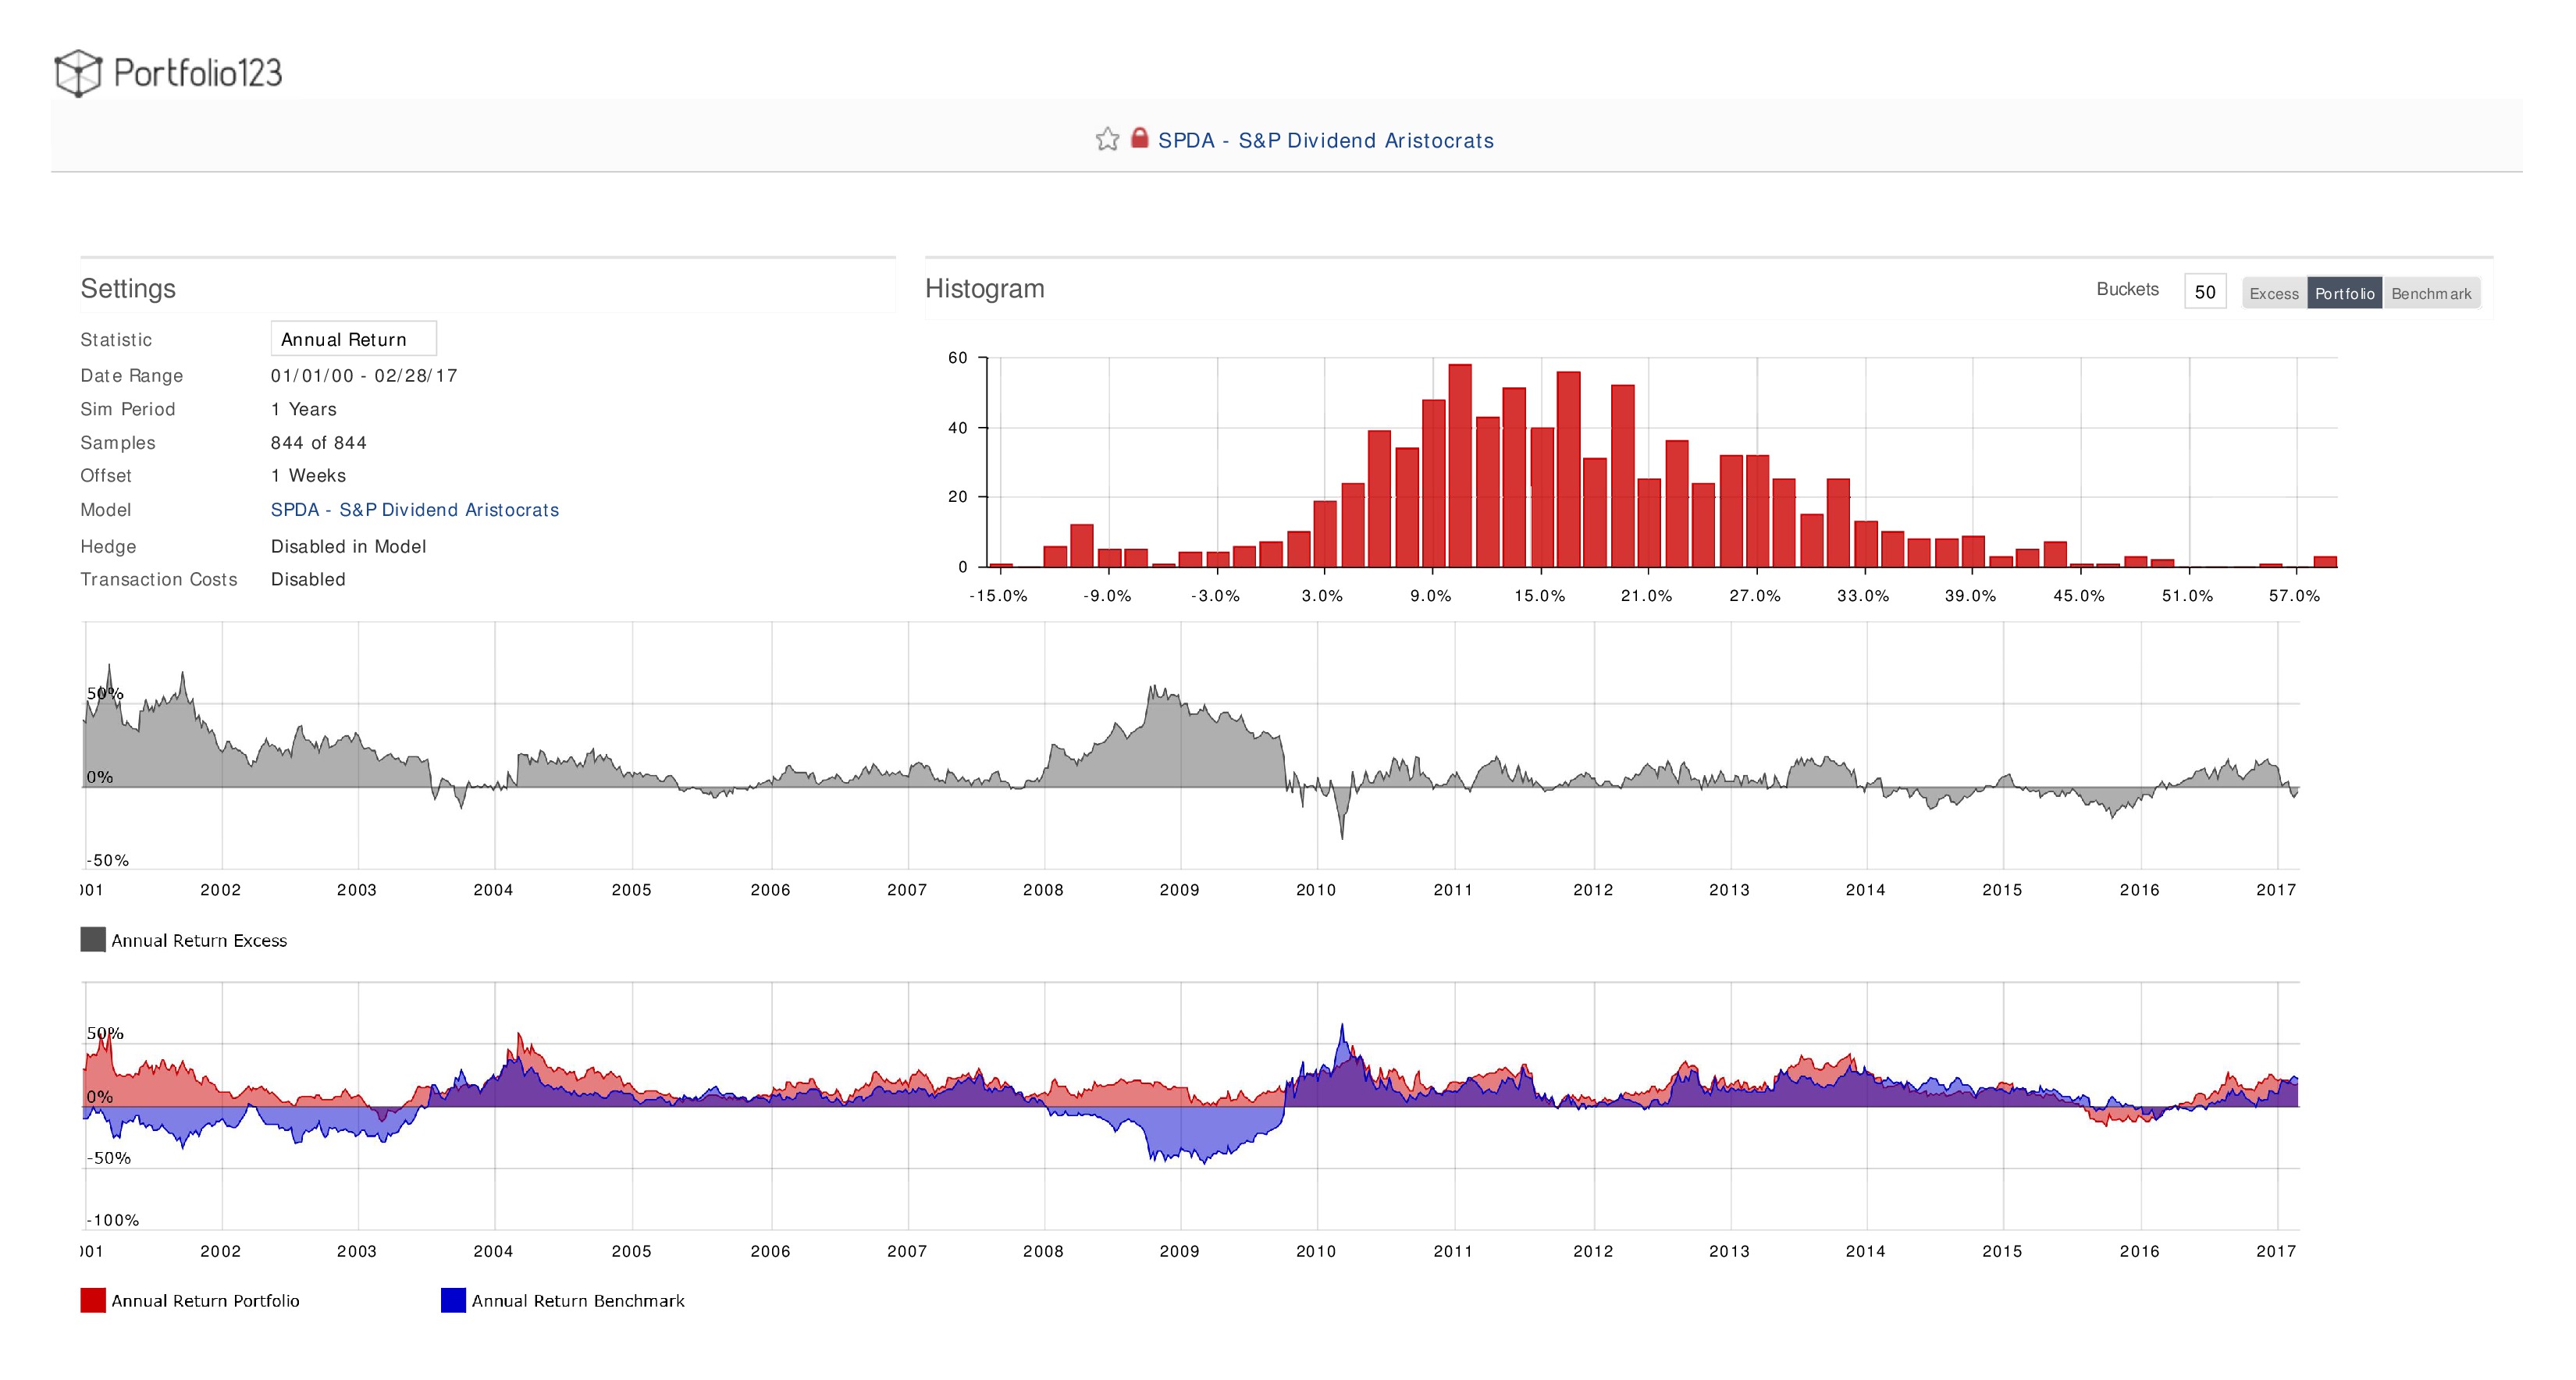
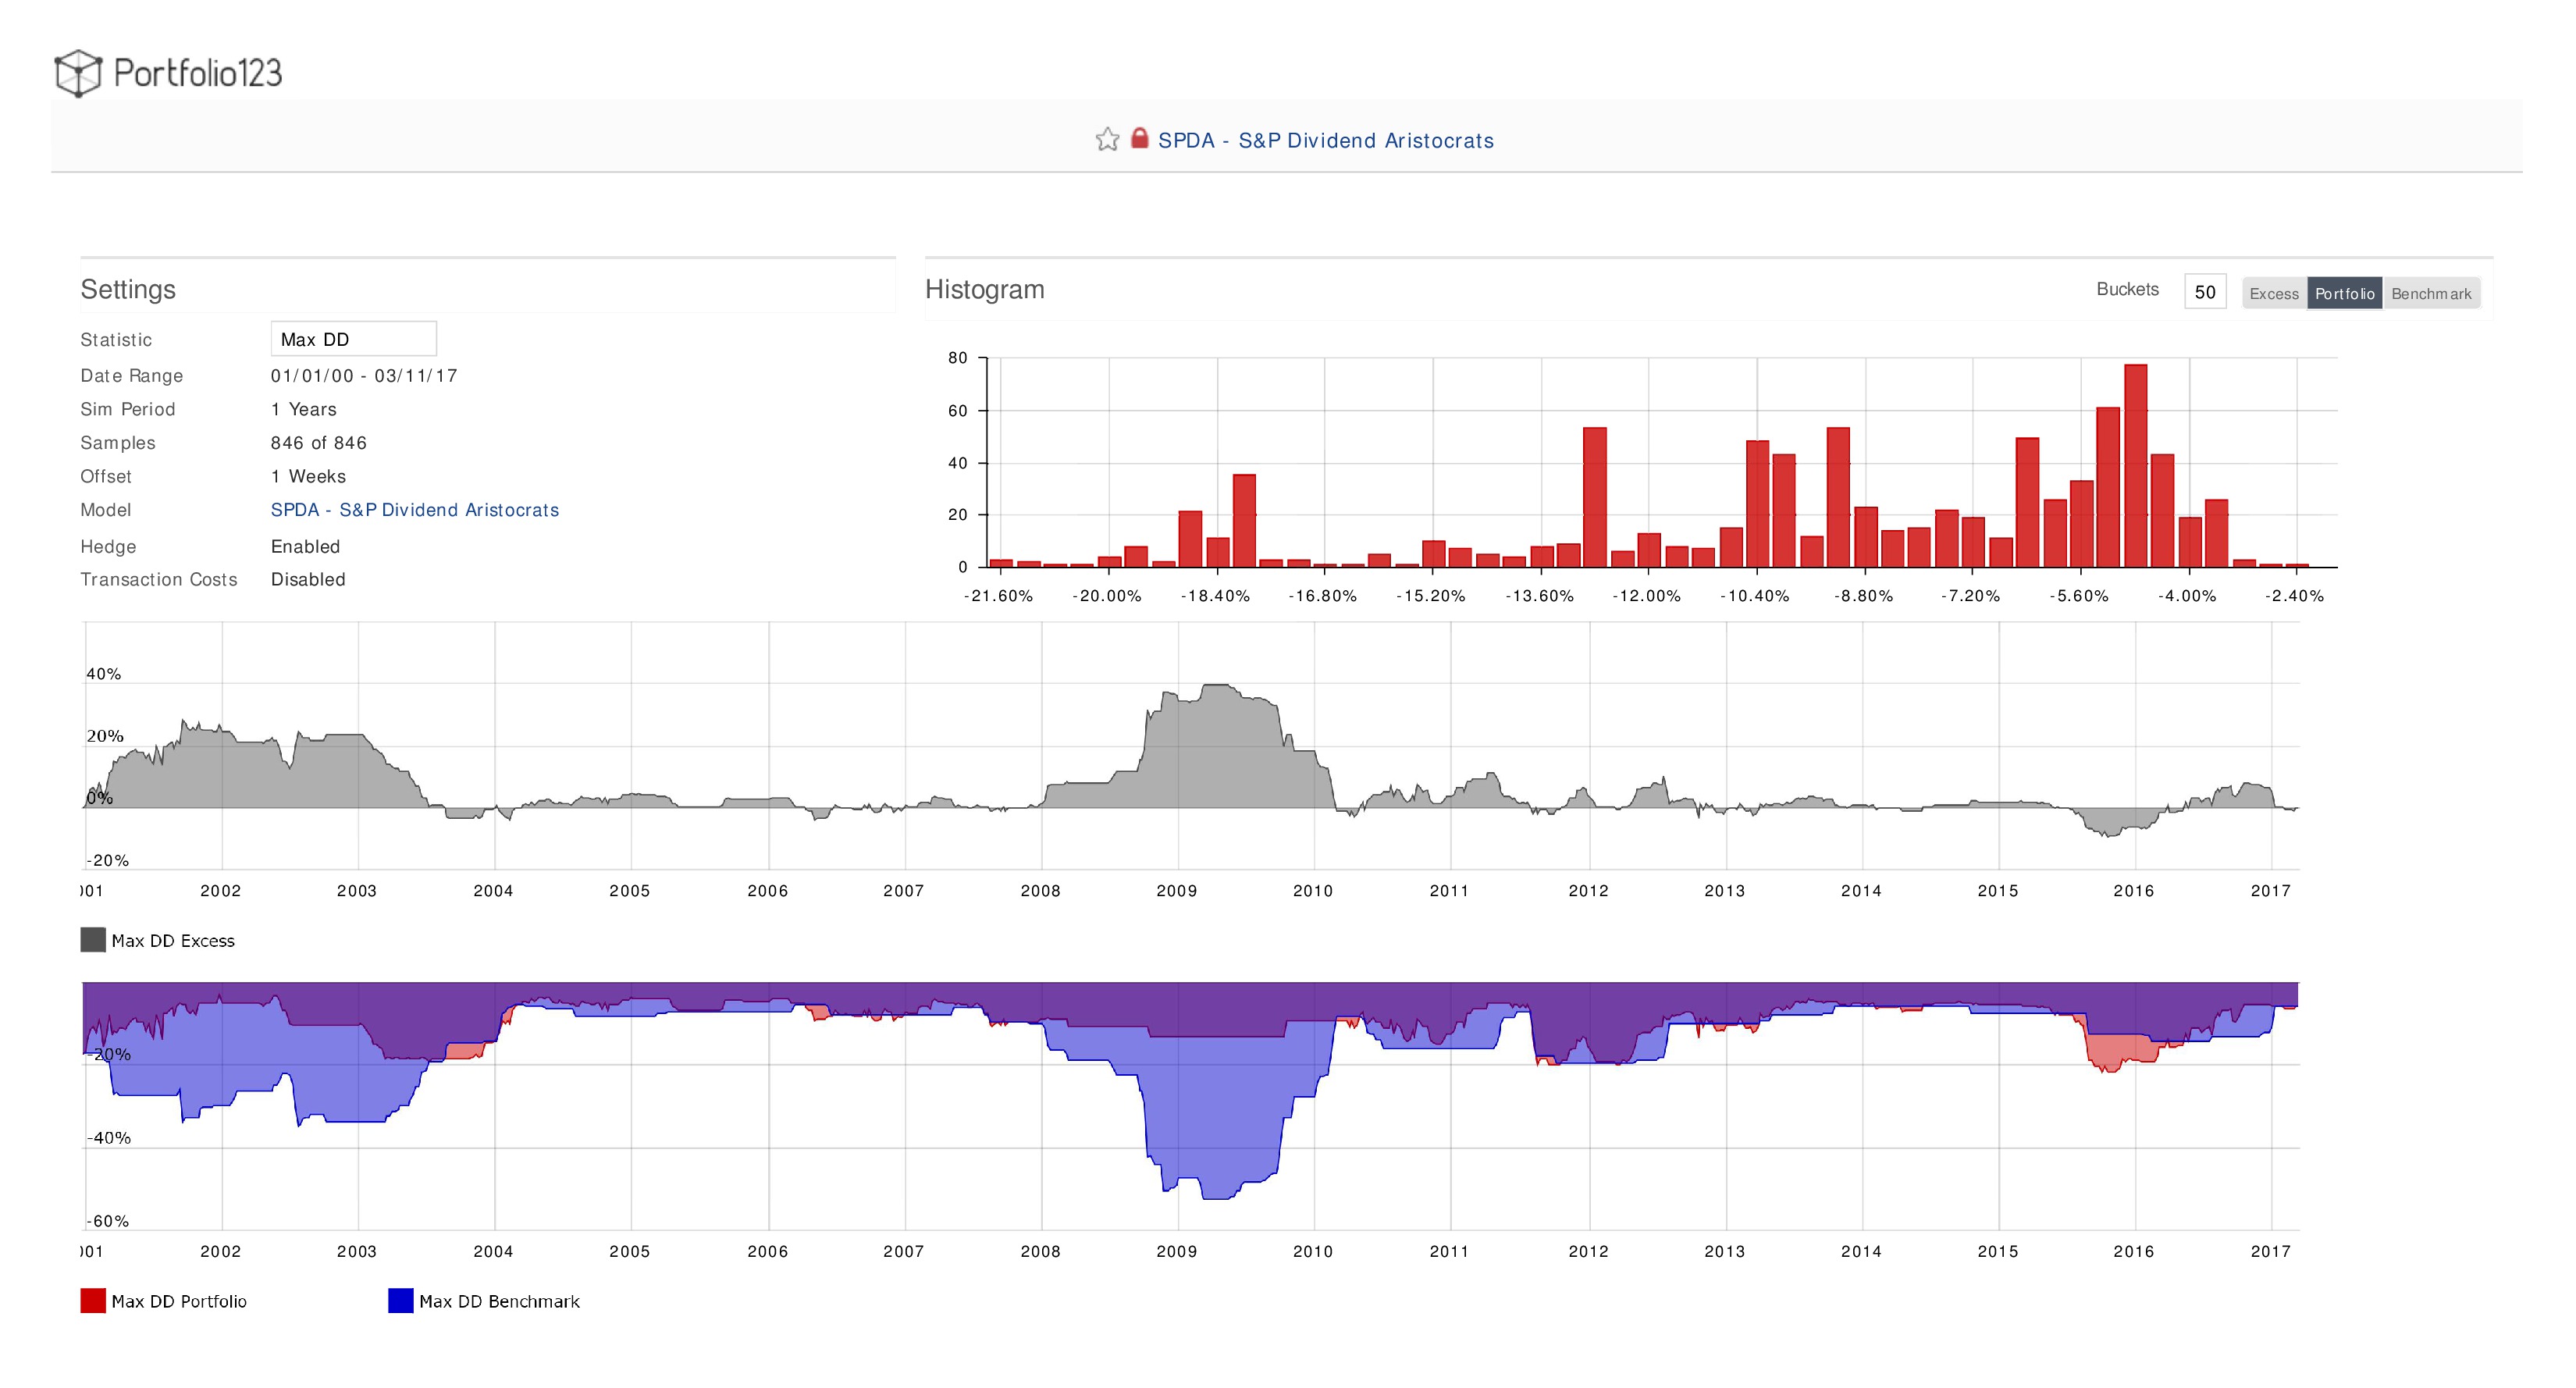
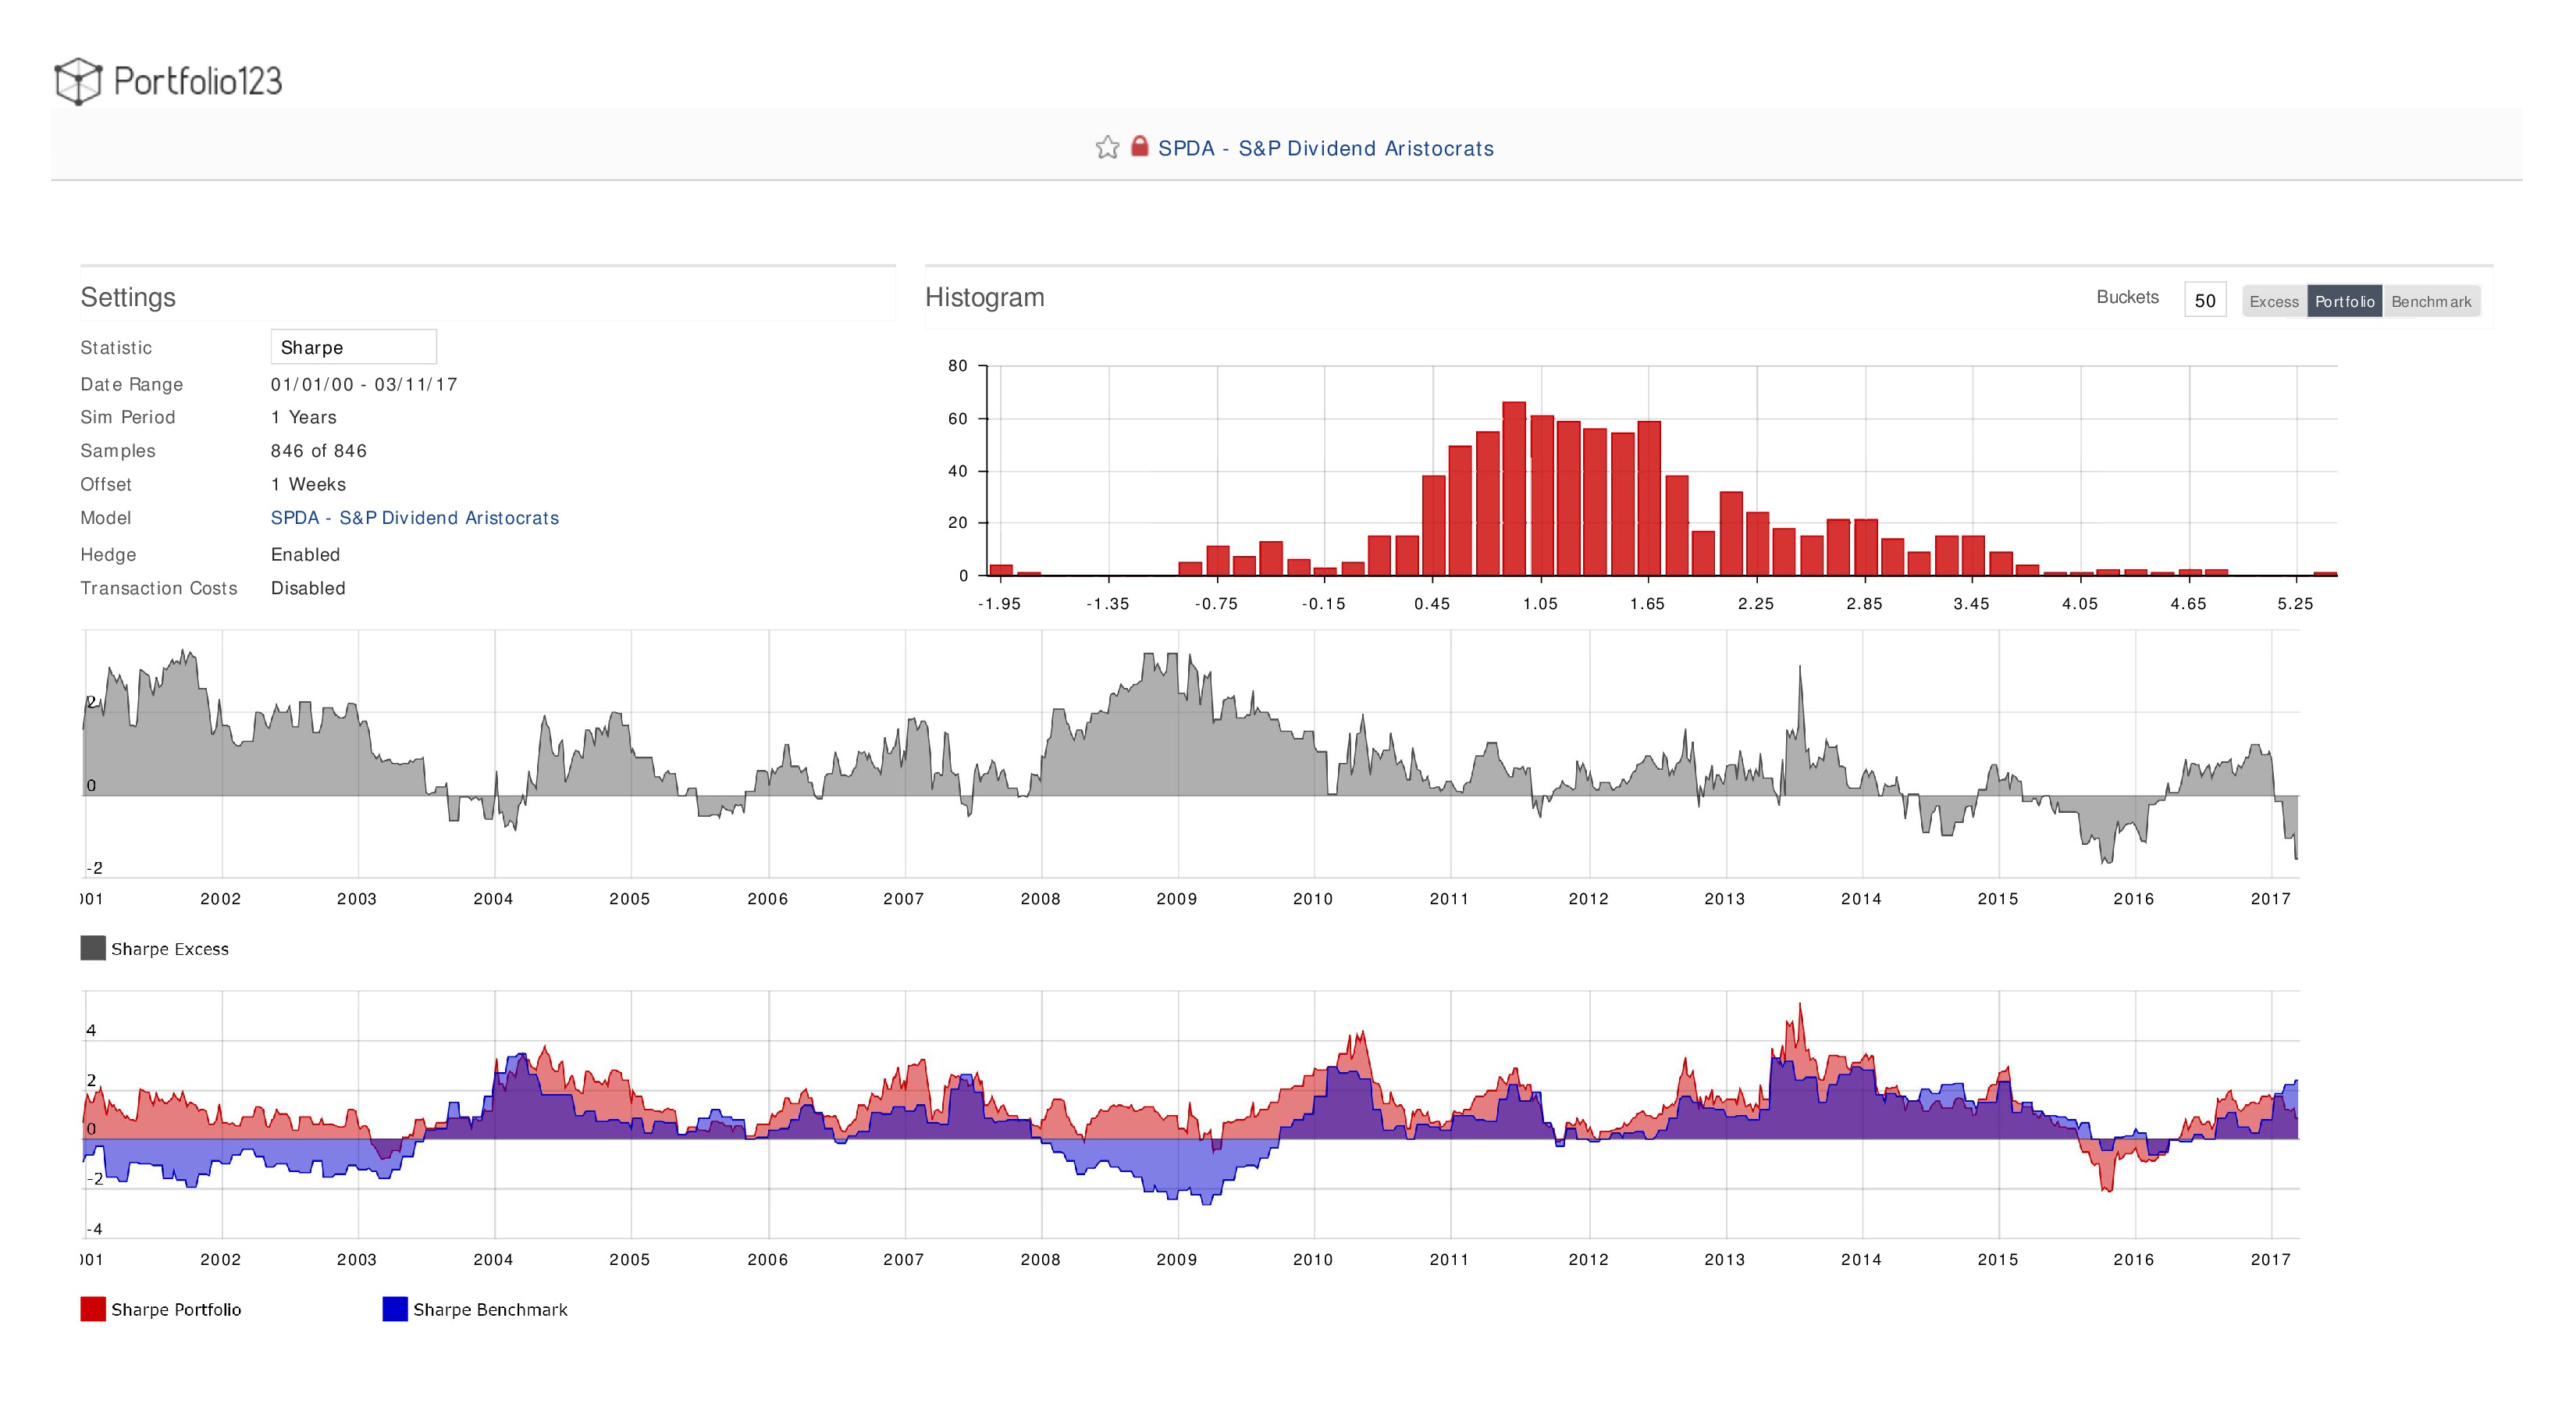
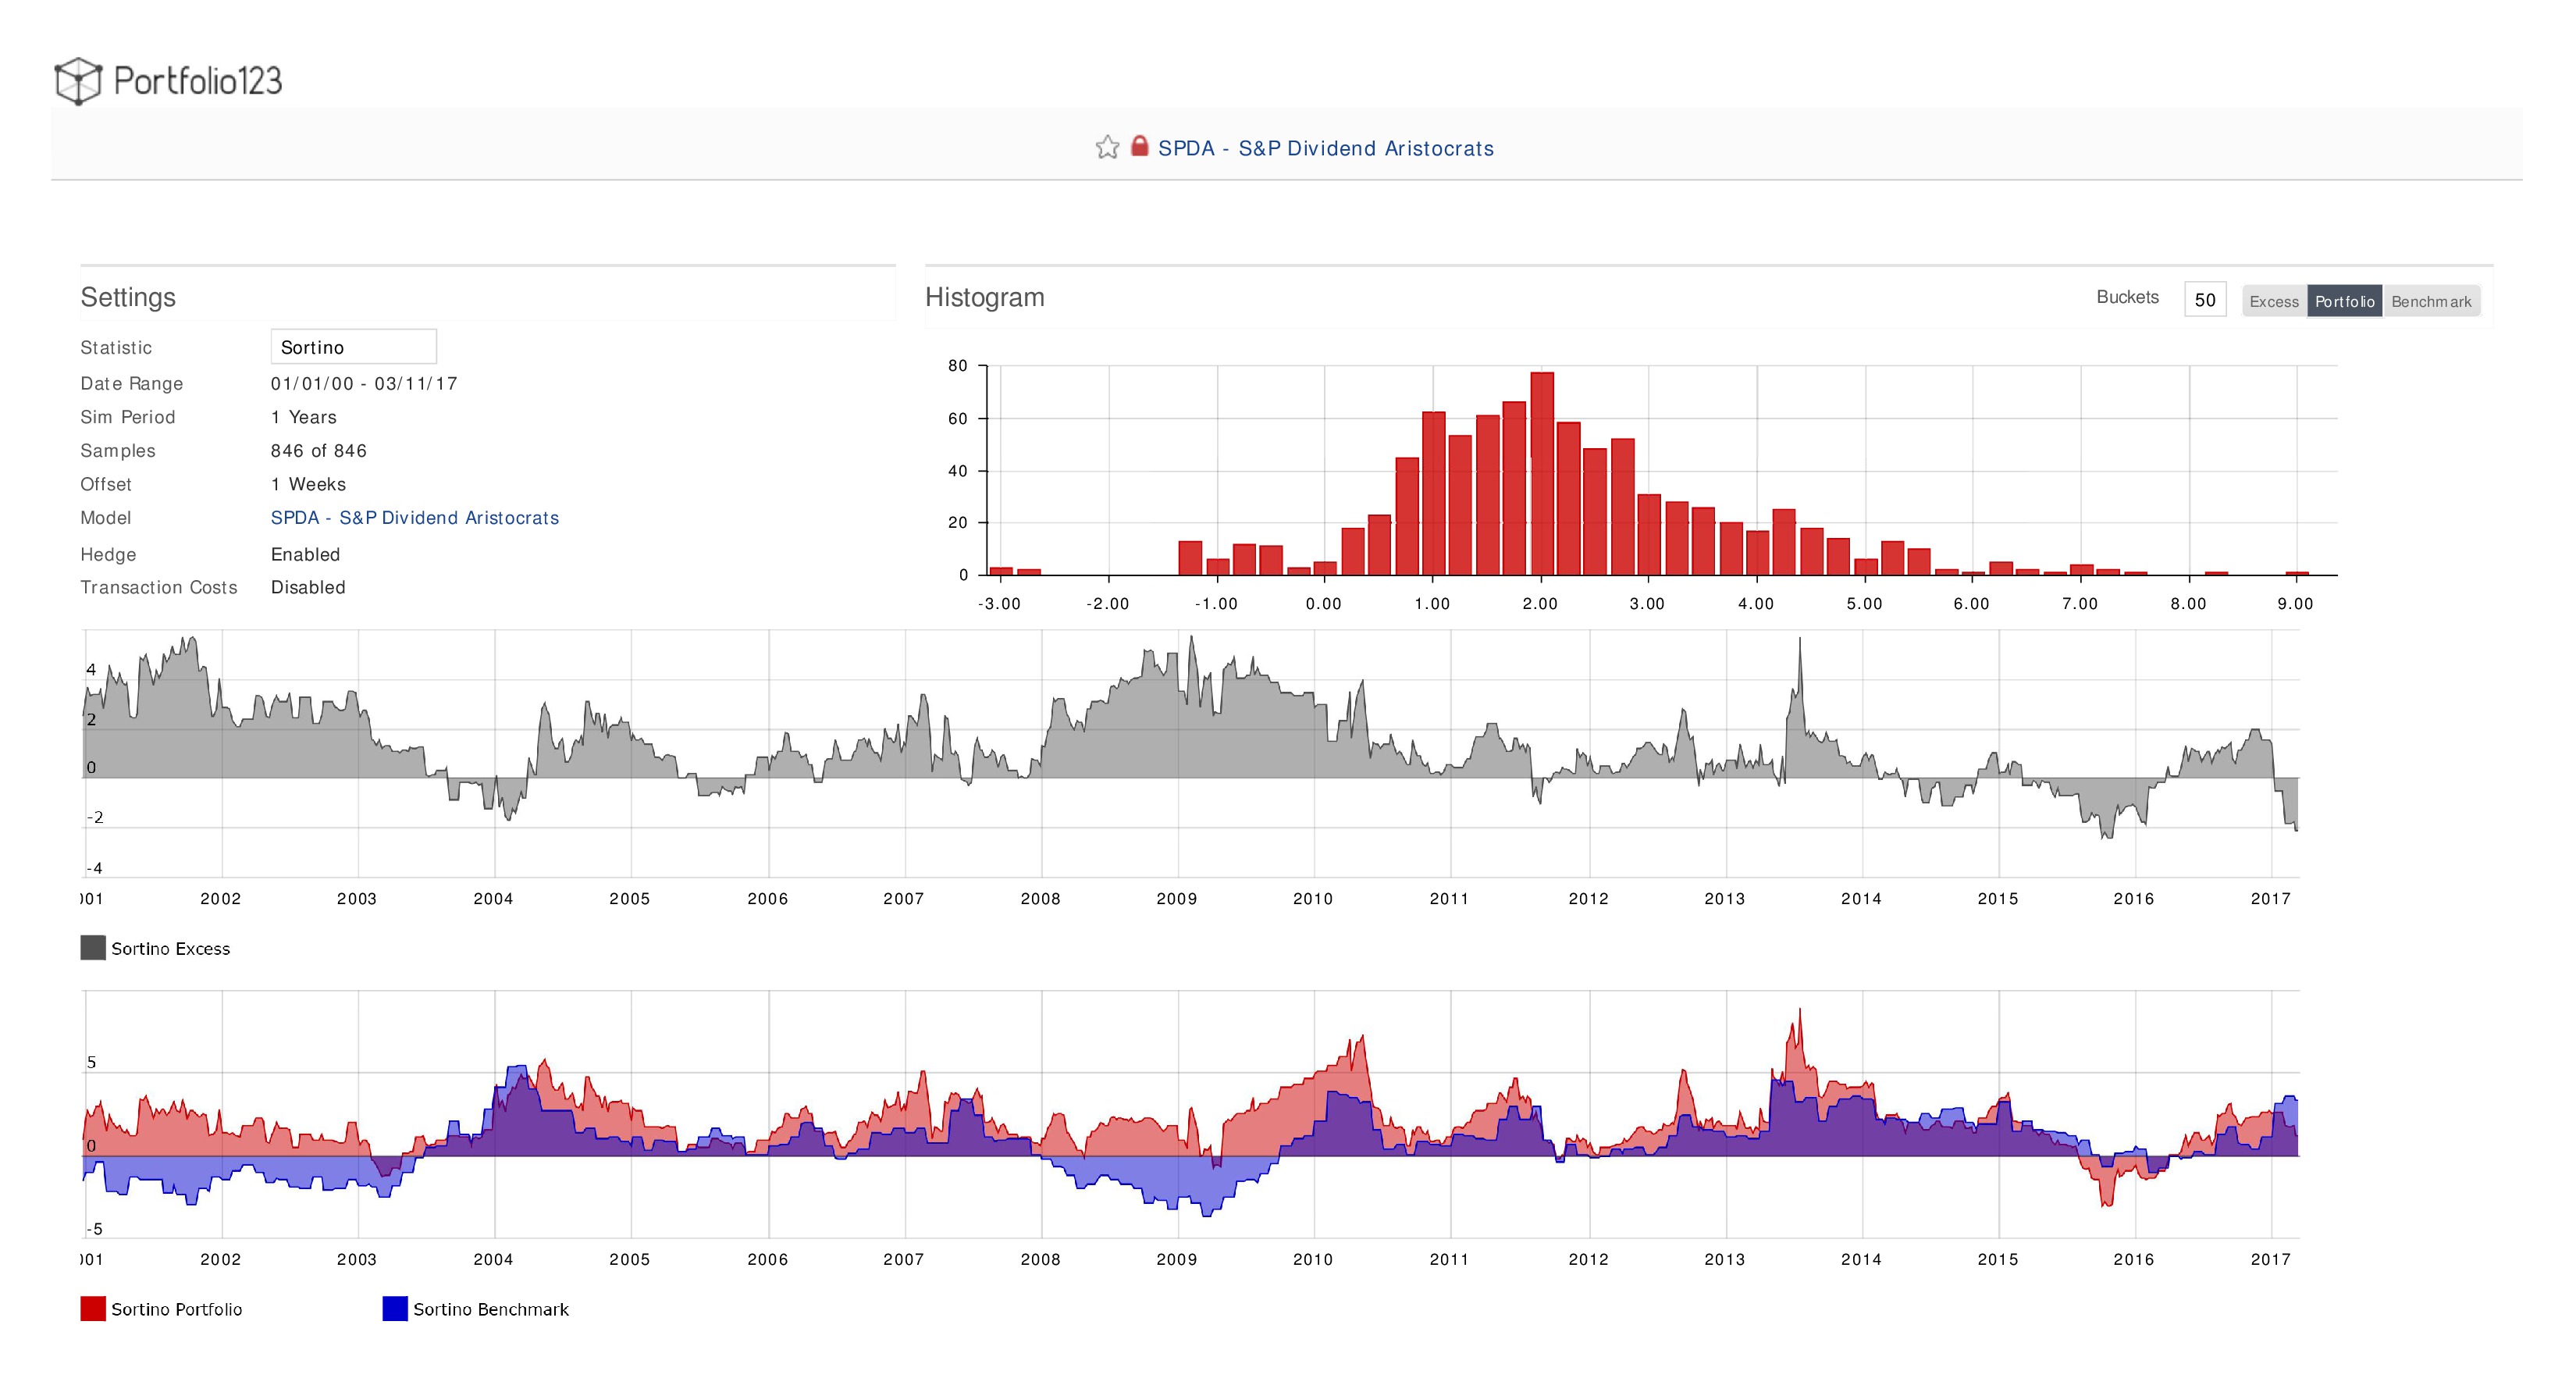
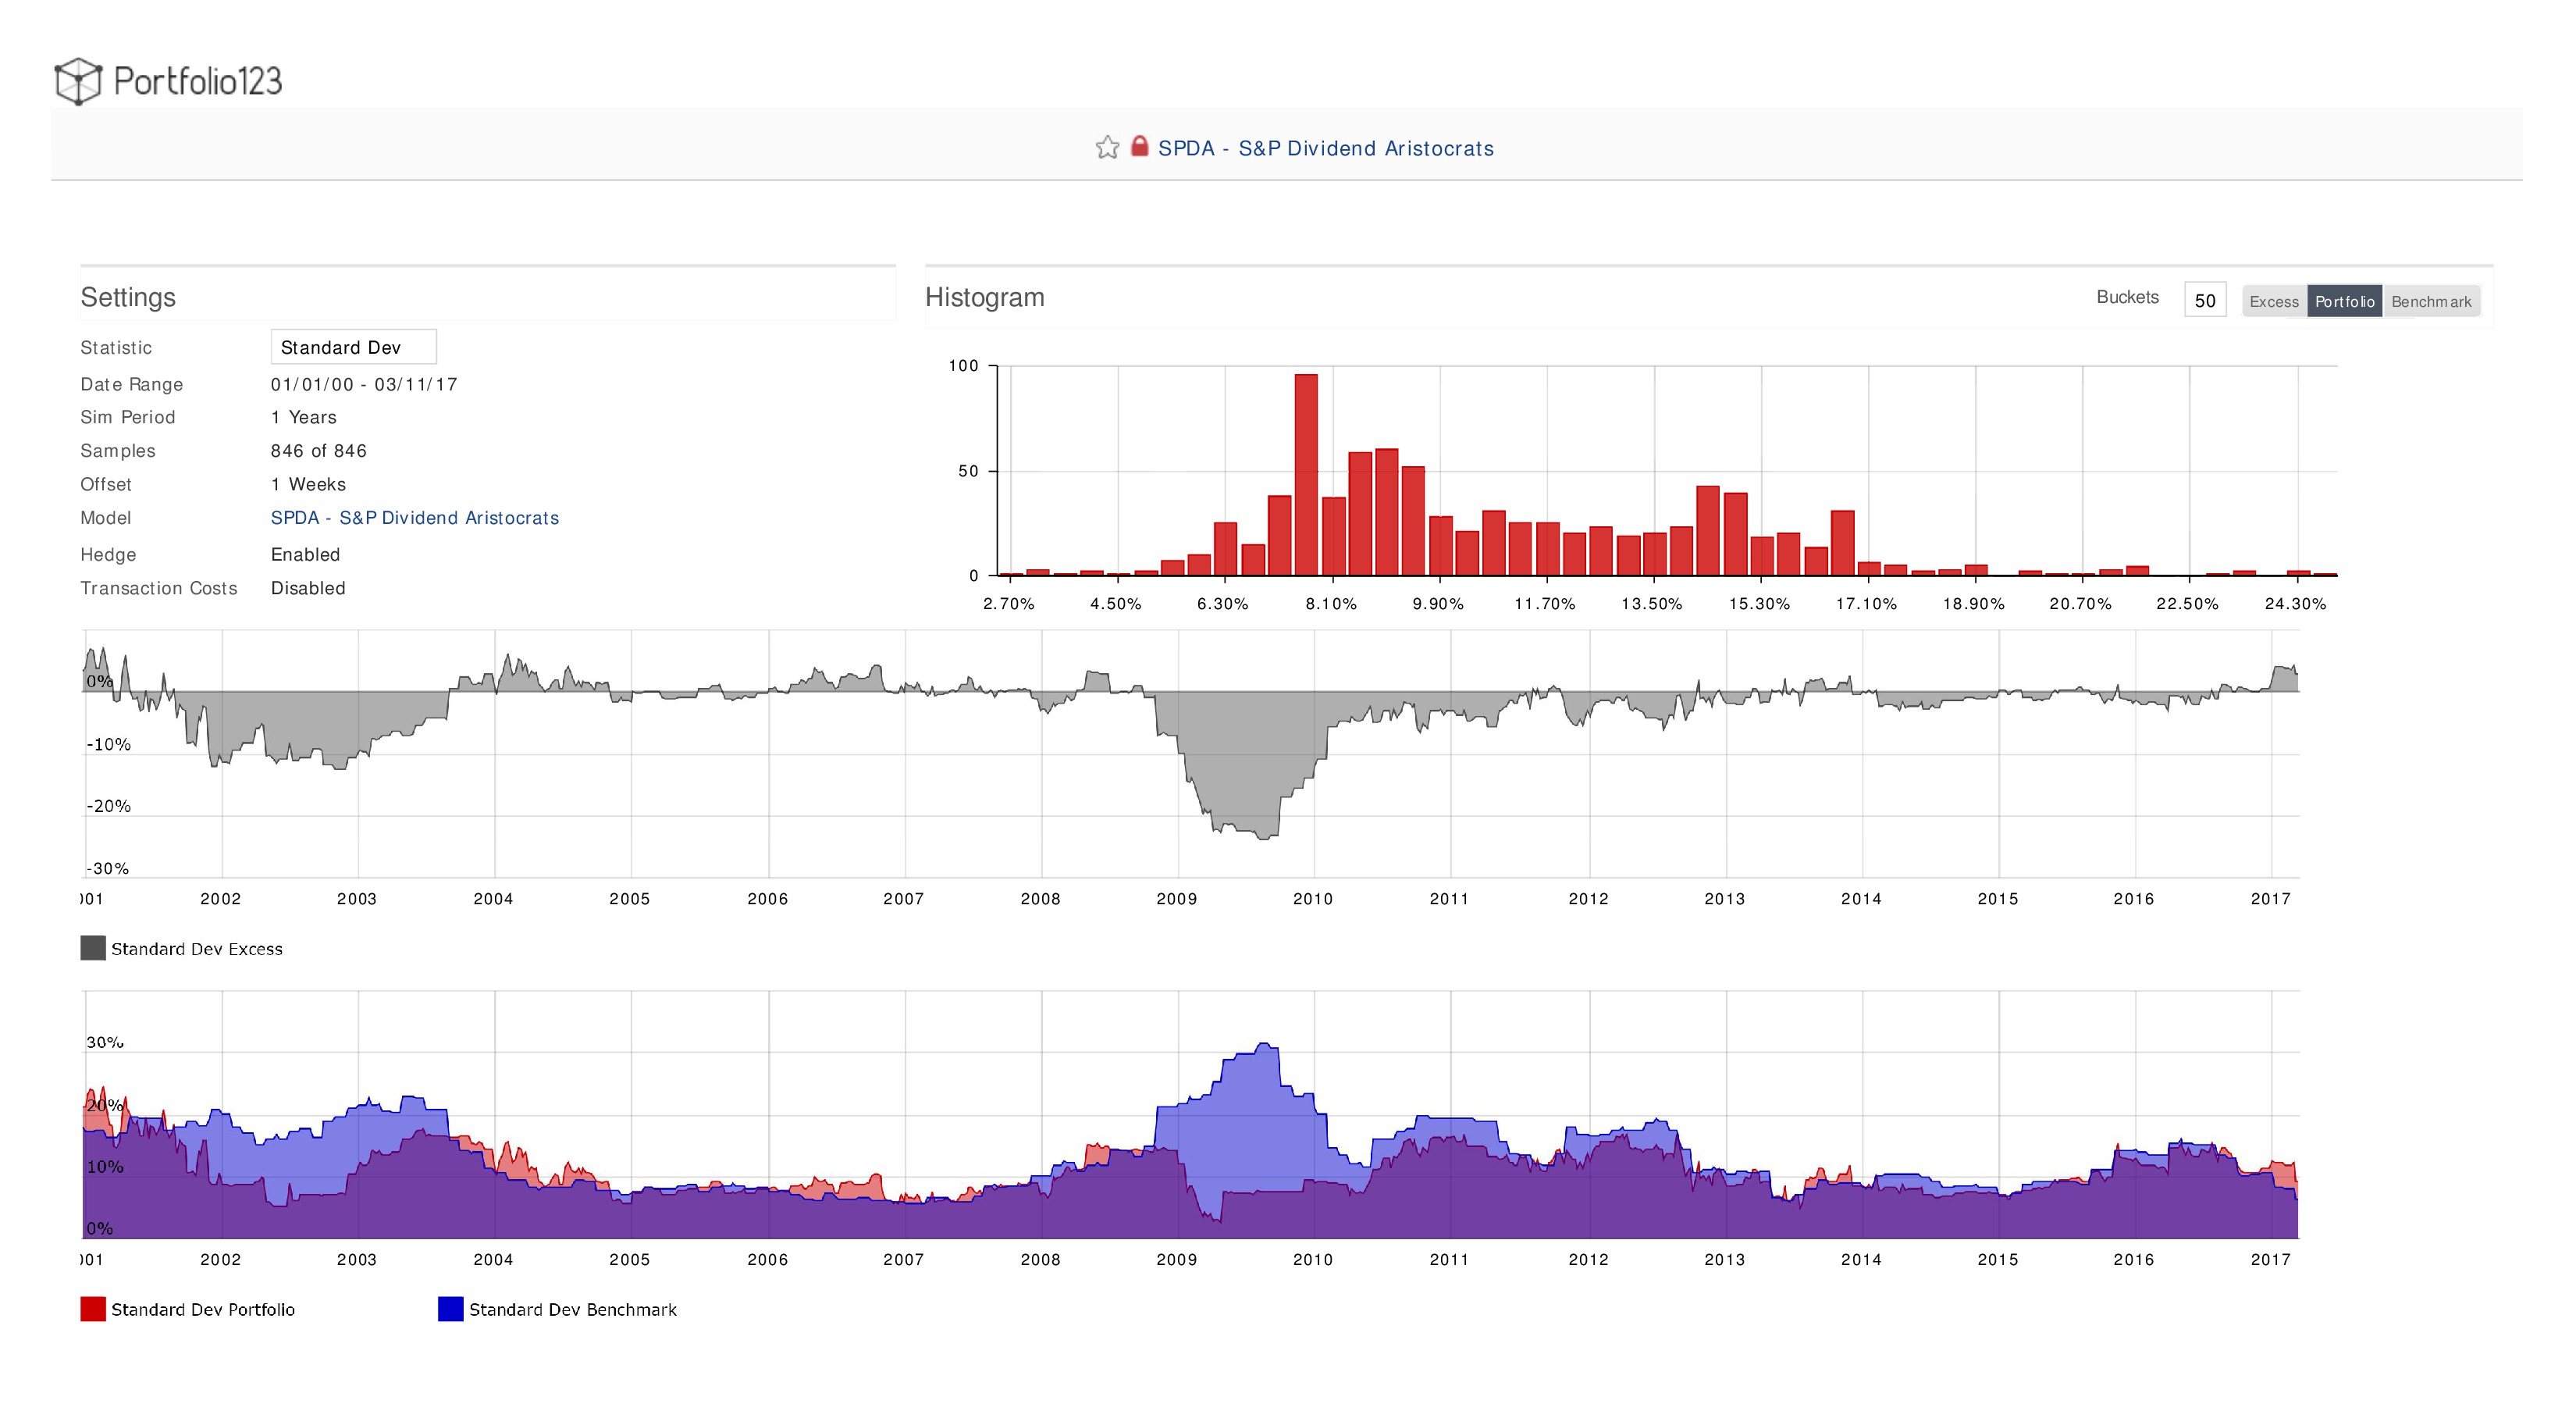
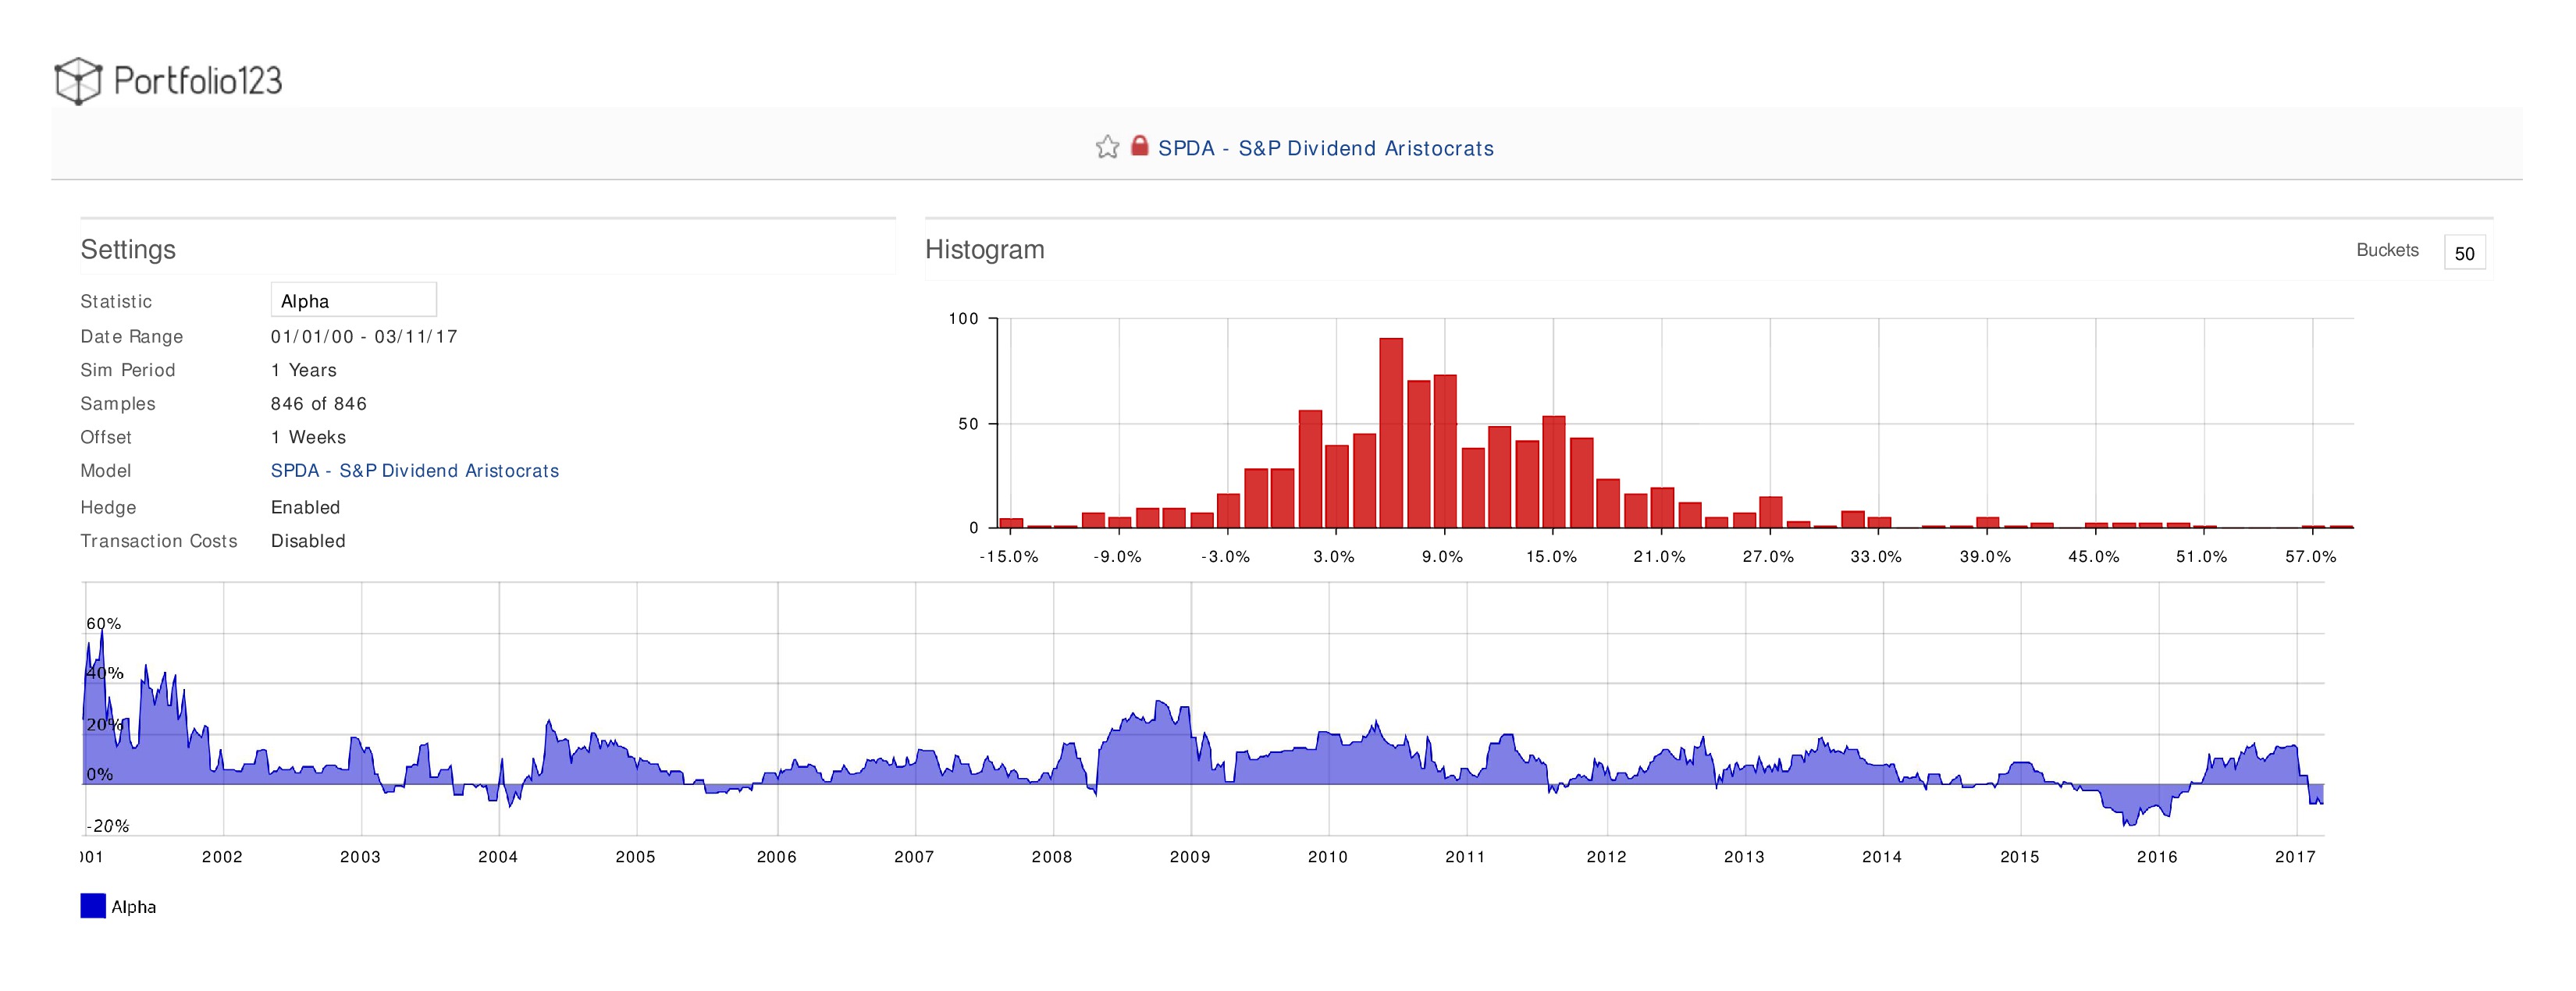
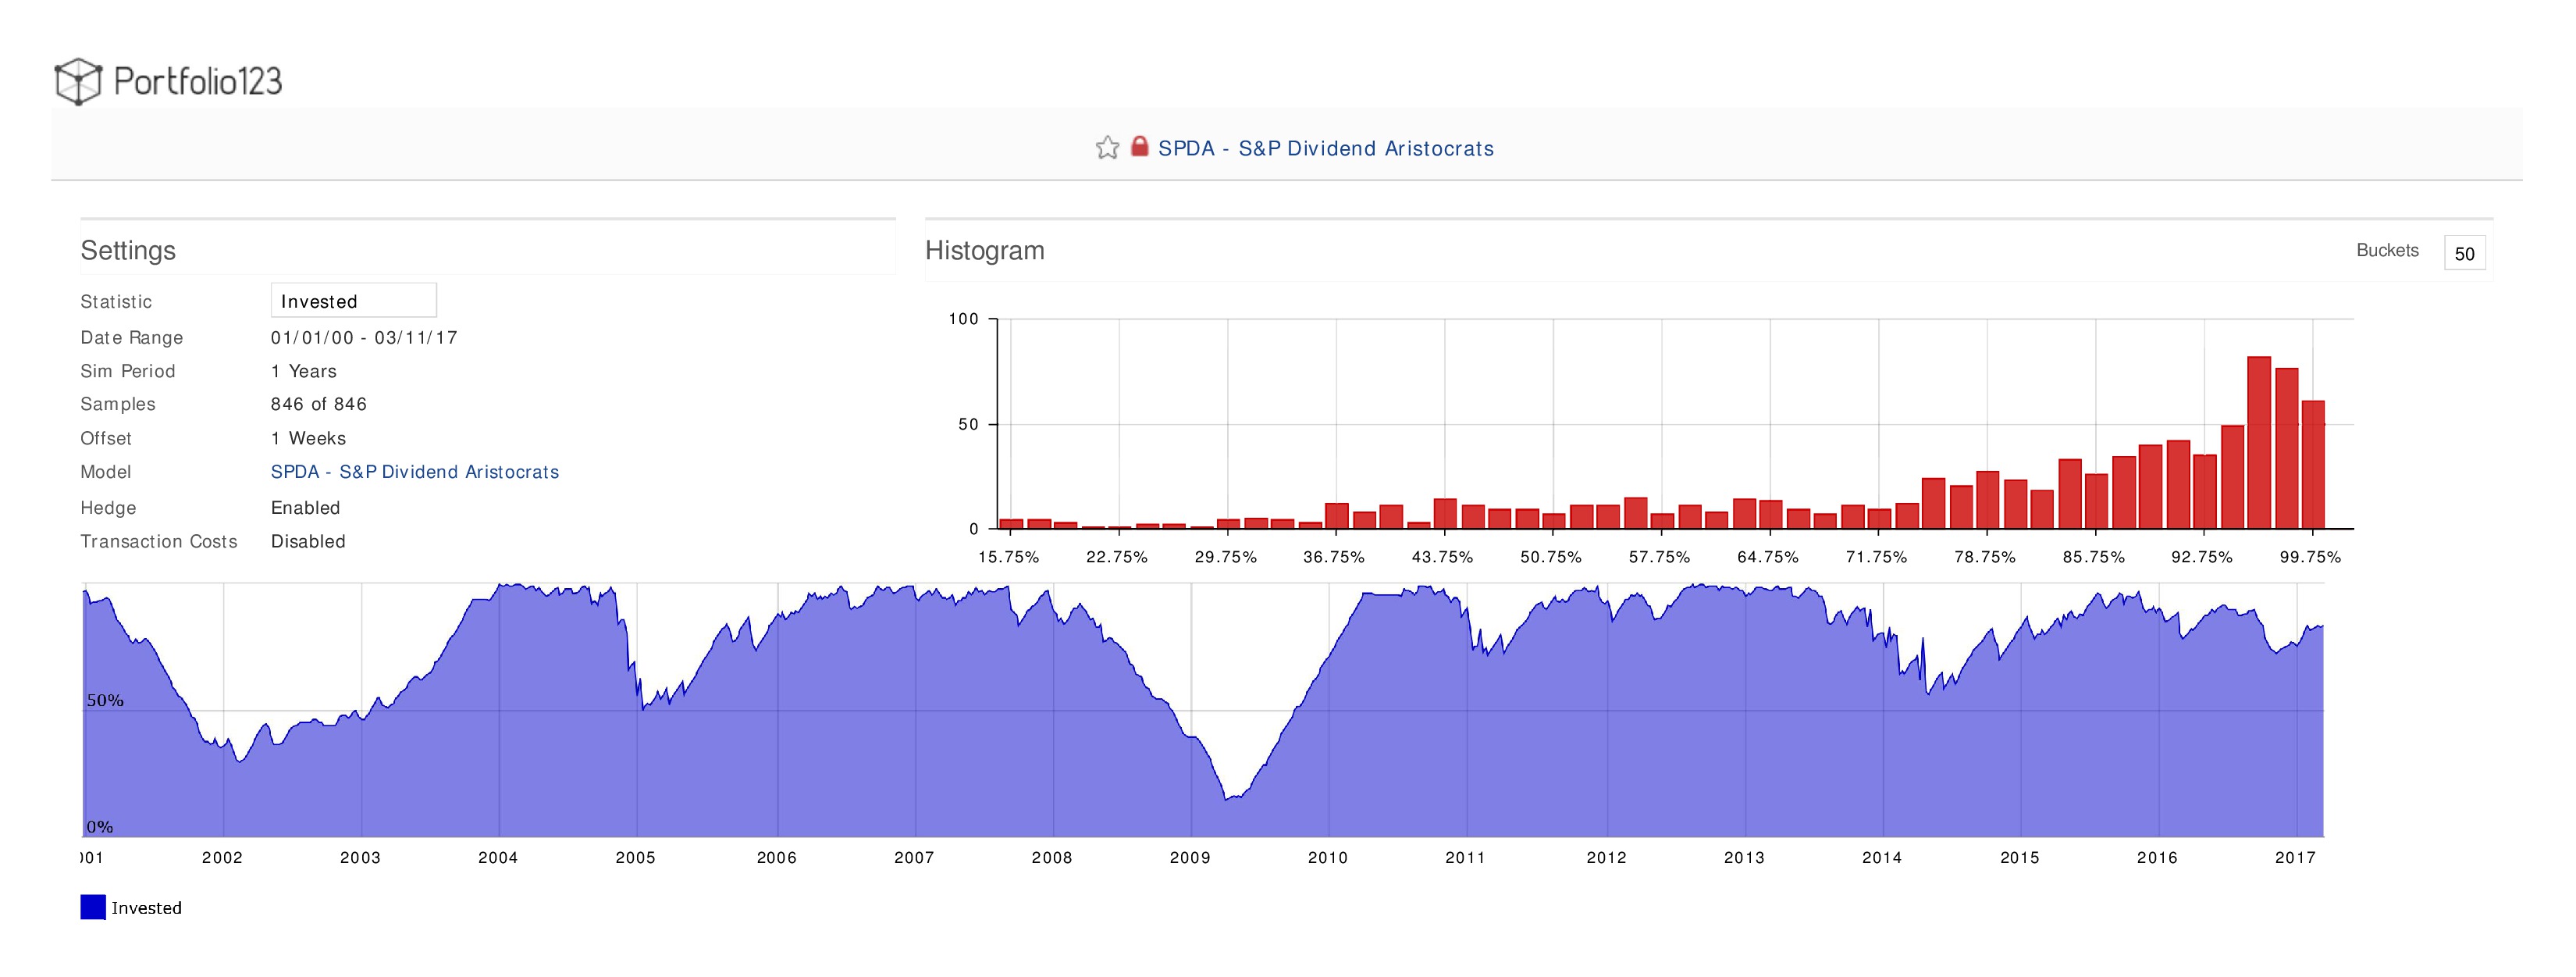
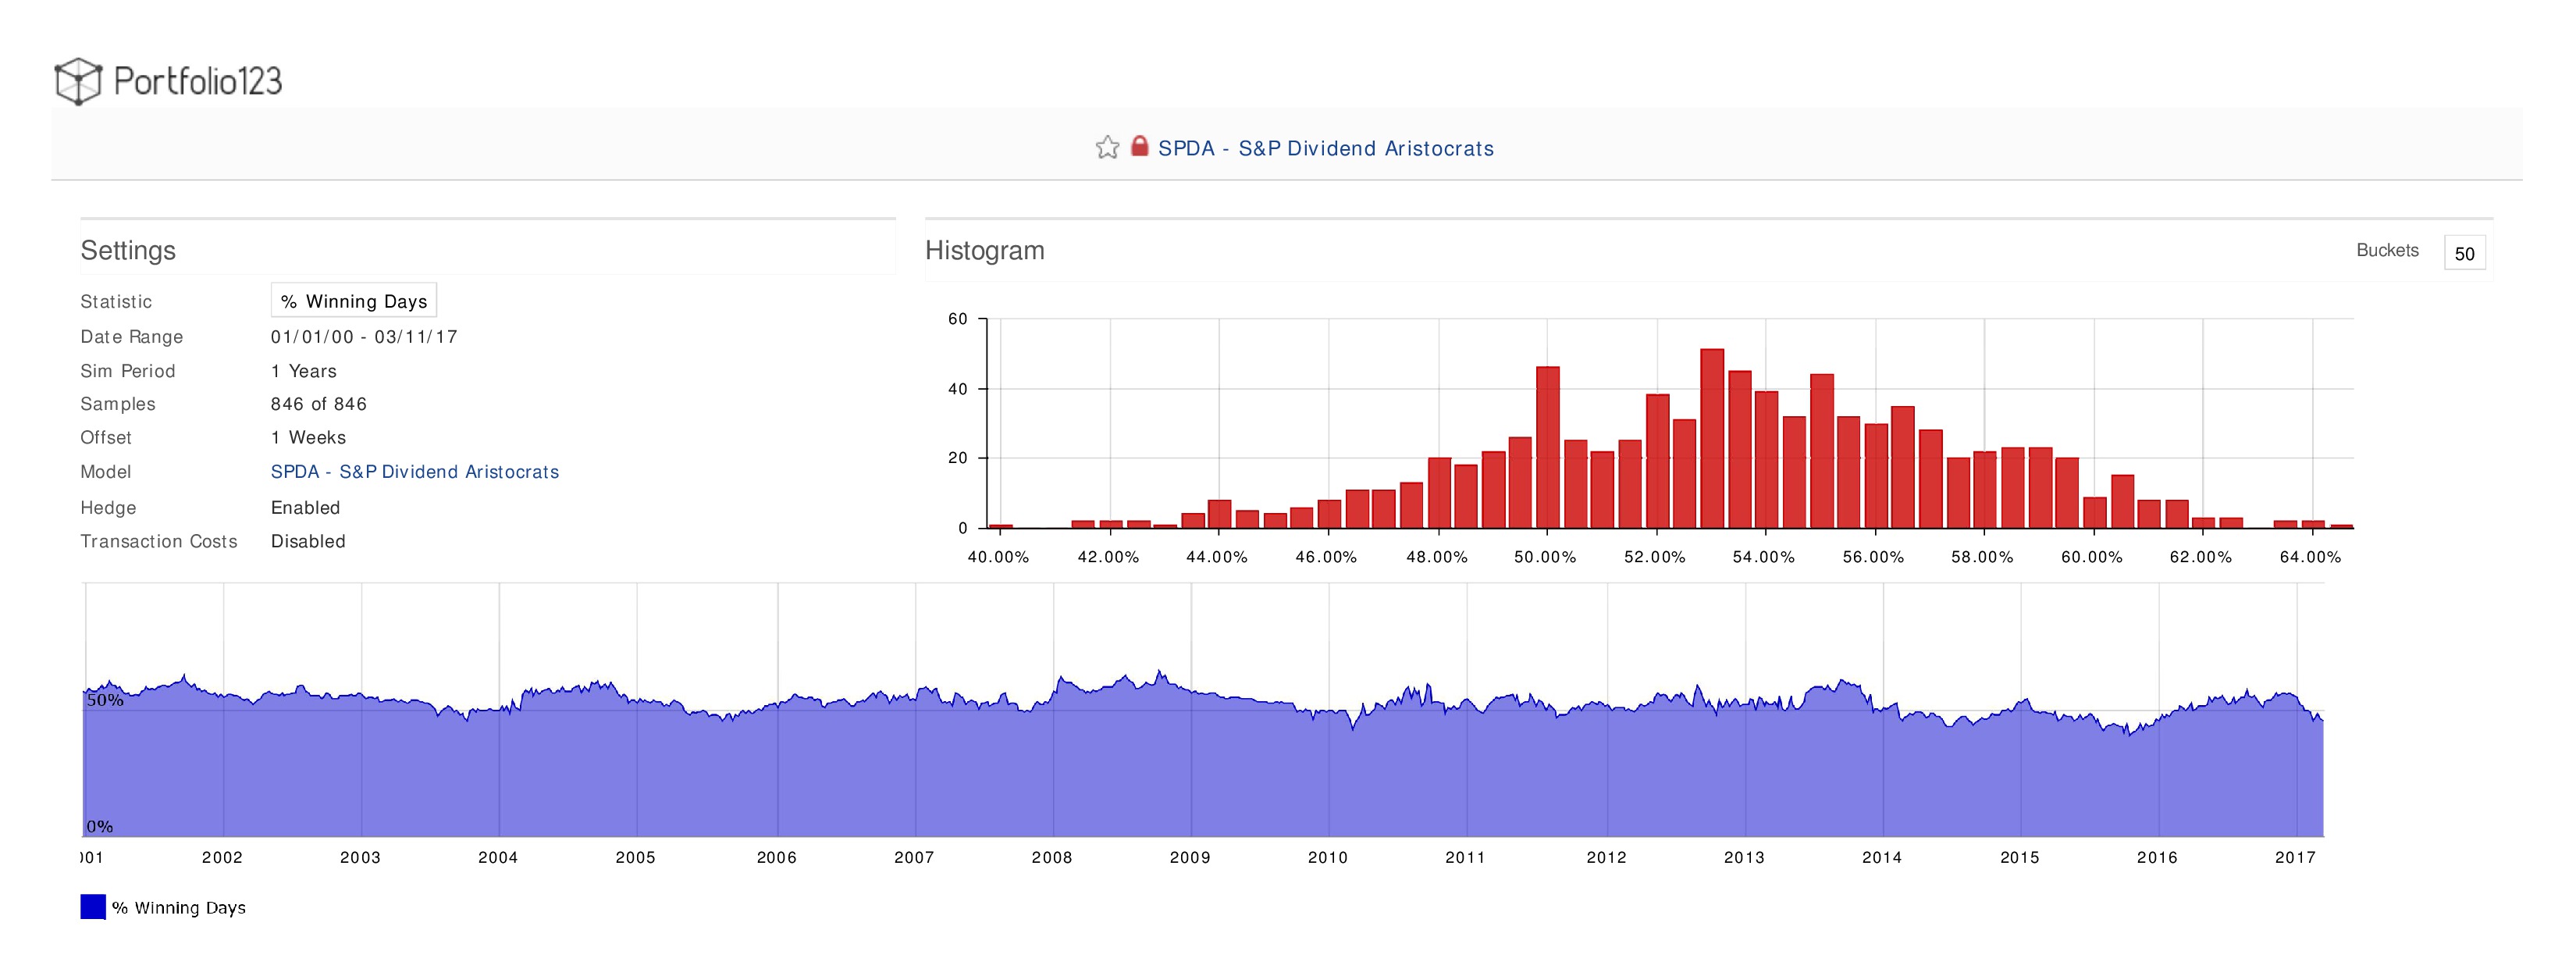
The charts below provide statistical analysis of the model. The charts are created for a rolling 1 year period with a 1 week offset starting with January 1, 2000. The charts are drafted to show 844 fiscal one year rolling returns. More detail will follow to explain each chart.
Period Return
Annual Returns (Similar to Period Returns)
Maximum Drawdowns
The Sharpe Ratio
The Sortino Ratio
Standard Deviations (Measure of Volatility)
Alpha (the Excess Return vs. S&P 500)
Beta (Volatility vs. S&P 500)
Percentage of Account Invested in Stock Market
Percentage of Winning Days


